

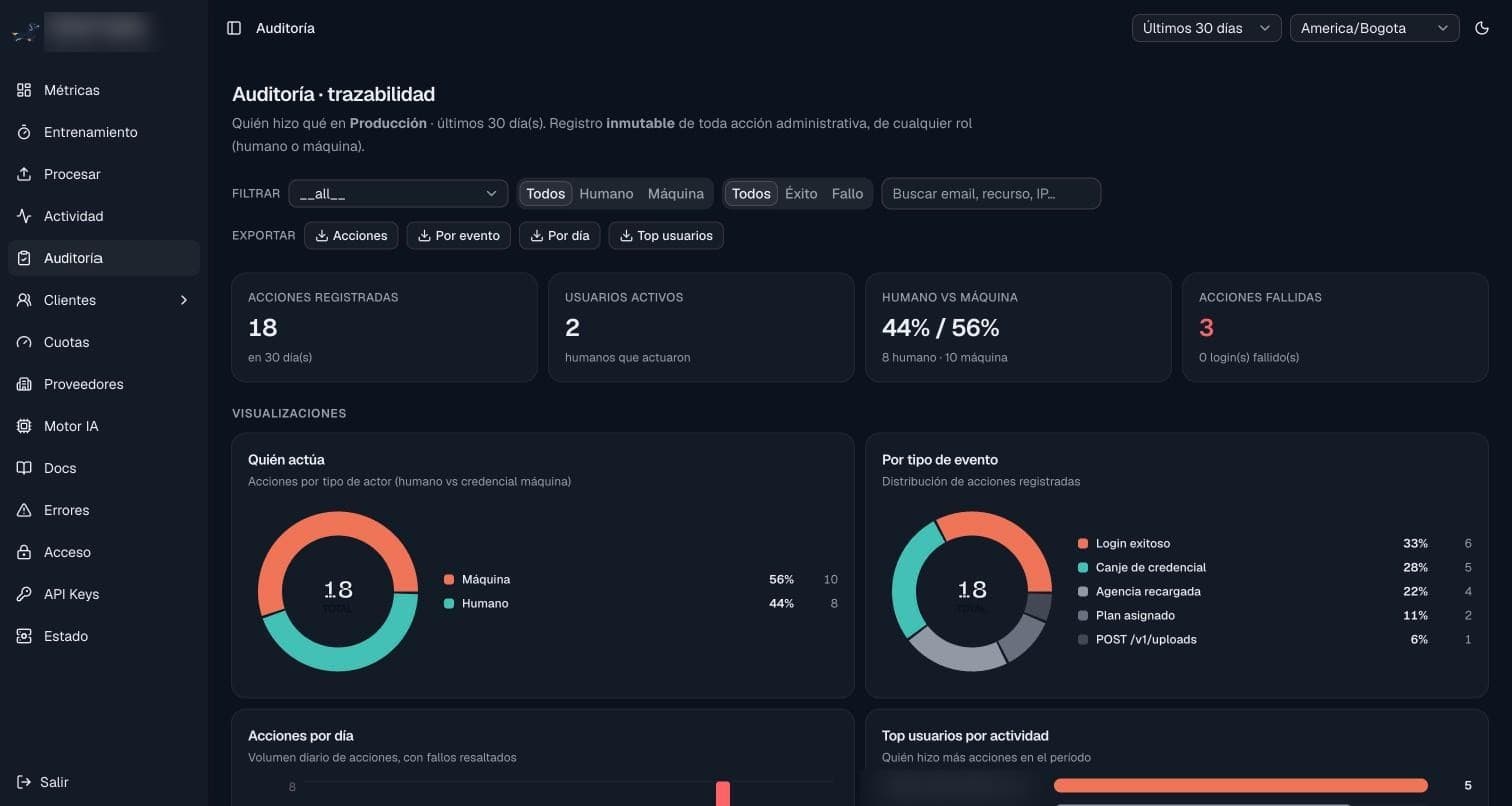
How we look after a product after launch: five habits for measuring in production
 Lumintik2 min read
- Observabilidad
- Serverless
- Buenas prácticas
1. Publish the time split
A Server-Timing header costs one line and is readable in the browser's Network tab. Ours states how long the read took, how many days came from the cache, how much went to decompressing, mapping, aggregating and collecting. Without it we would have optimized the database when the problem was a date formatter.
2. Read the REPORT lines
Every serverless execution leaves a line in CloudWatch with duration, init time and peak memory. It is the source that says how much headroom is left before a usage spike shows up on someone's screen.
3. Expose memory
We added live memory, committed memory and the real ceiling of the process to Server-Timing. With that, decisions about caching and concurrency stop being opinions.
4. Budgets counted from entry
A time budget that starts when the heavy work begins ignores cold start, credentials and serialization. The clock must start when the request enters, and a partial response must say it is one.
5. Measure where it runs
A 1024 MB Lambda has a little over half a CPU. A loop that takes one second on a laptop takes ten there. We measured locally against production data to understand memory, but CPU decisions were made with numbers from the real function.
With those five habits, the operations console of one of our clients went on to deliver a full month of metrics in six seconds. None of them needs new tools: only looking at what is already there, every week.
More posts
- www.lumintik.com
 Lumintik
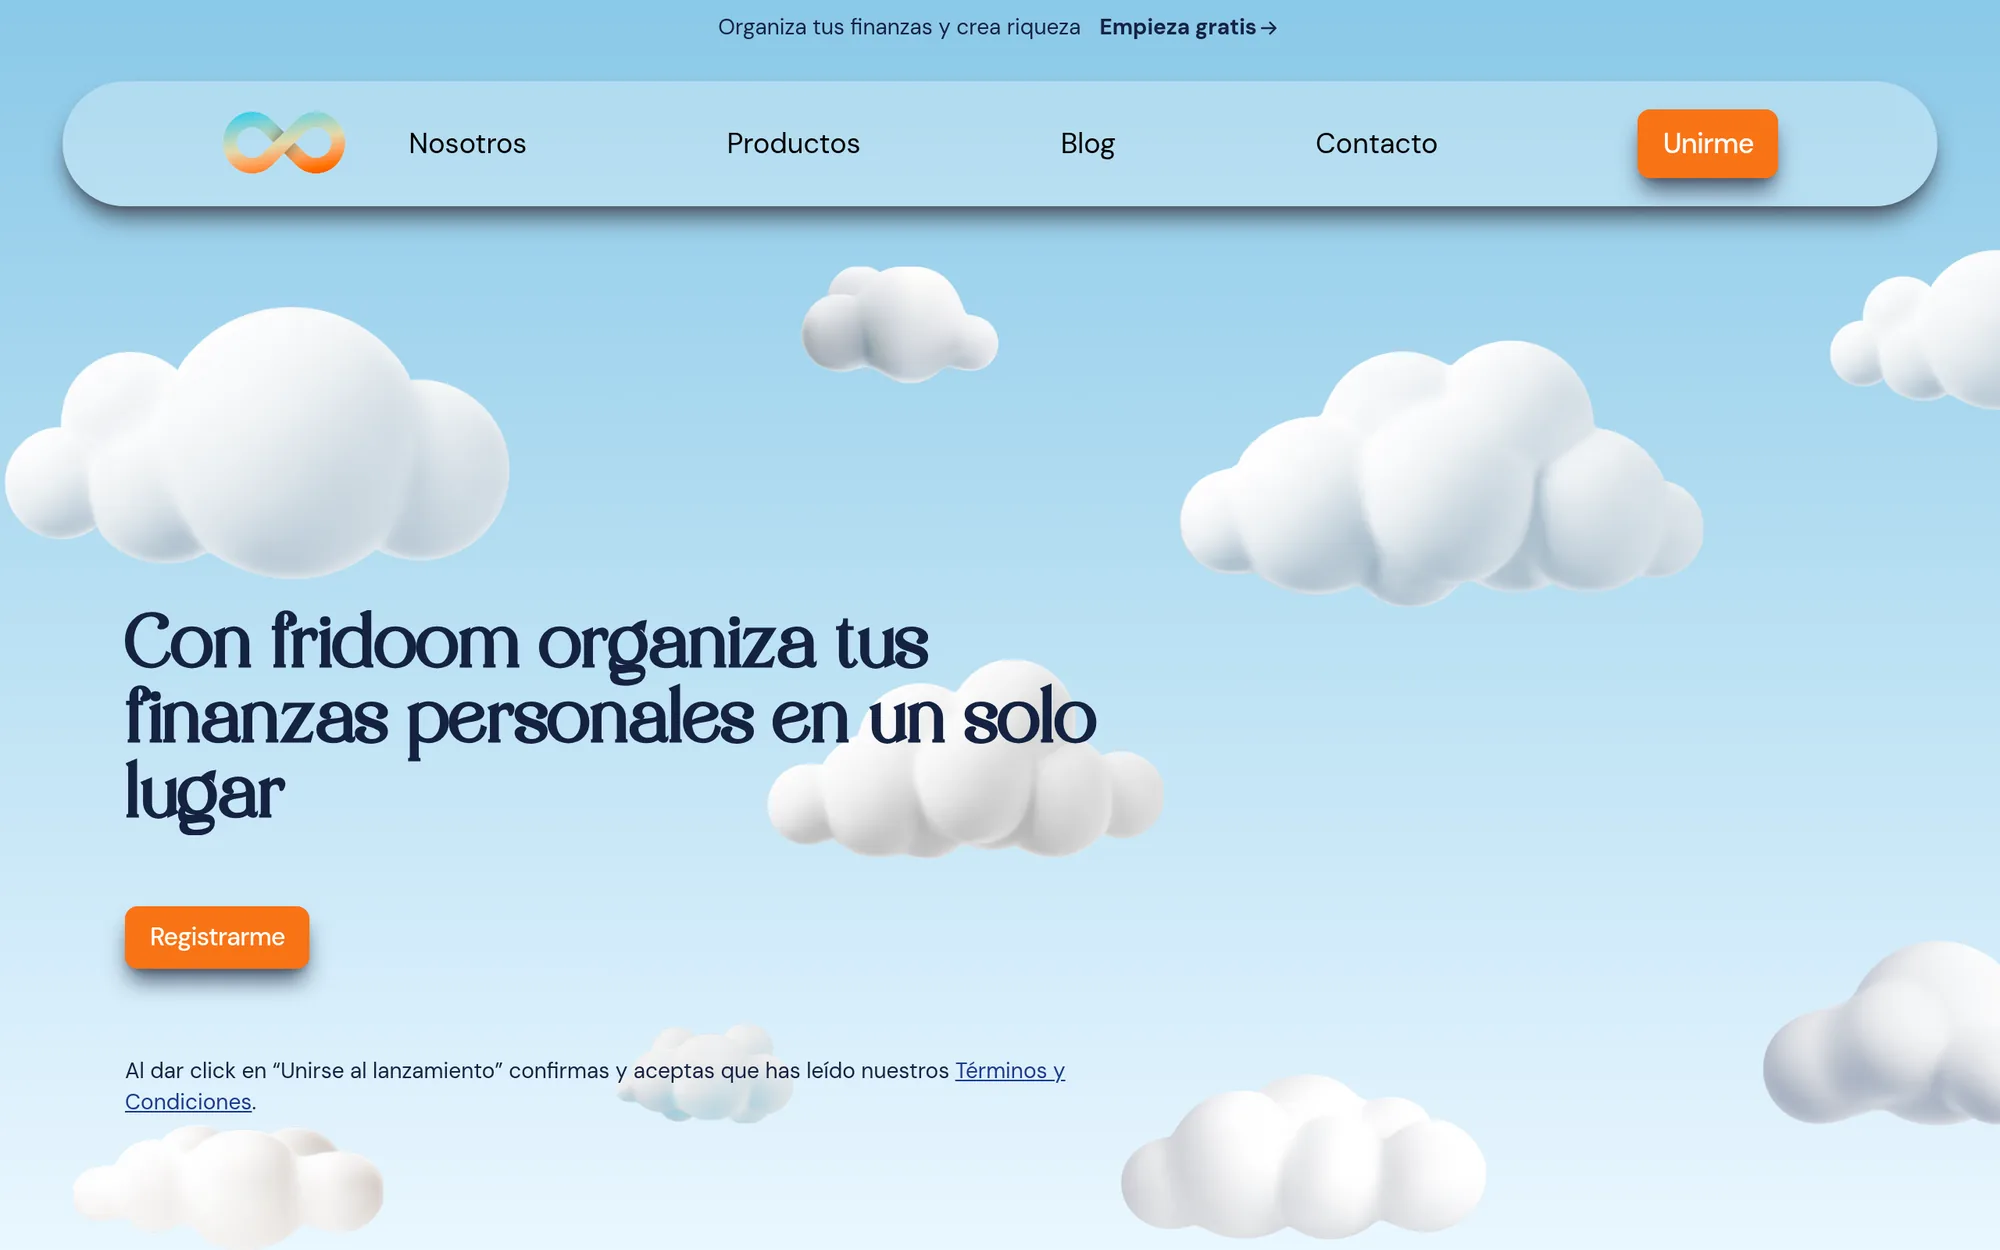
Every account on one screen: what Fridoom solves
A person's money lives spread across banks, cards, investments and a spreadsheet. Fridoom brings it together in one place, on the phone, without selling your attention.
- www.reco.com.mx
 Lumintik
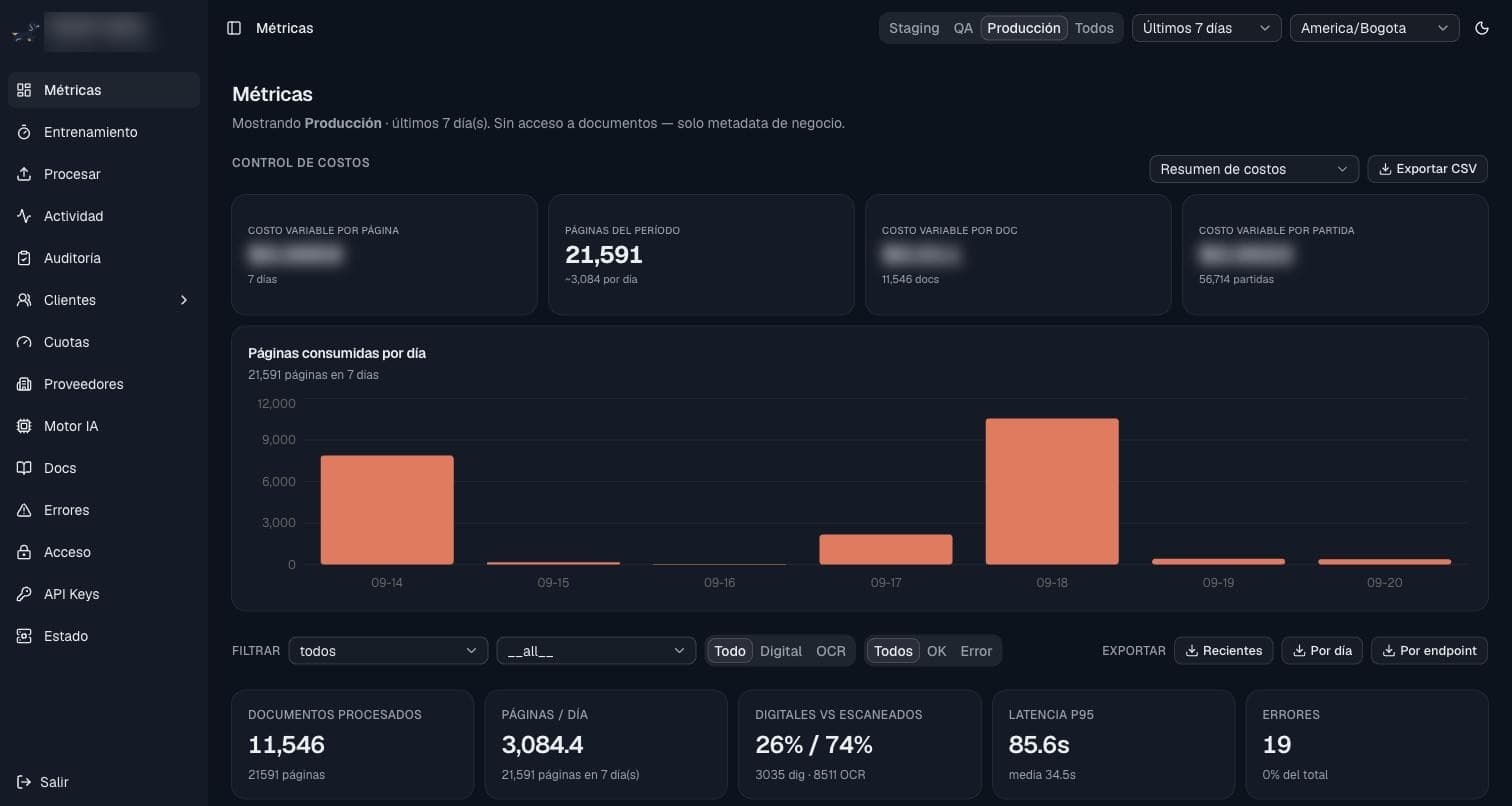
A console to see every document: what a customs agency gets beyond OCR
Reading invoices and customs entries with AI is half the job. The other half is knowing how many come in, how long they take, what fails and who did what. This is RECO's operations console.
- www.imagiq.com
 Lumintik
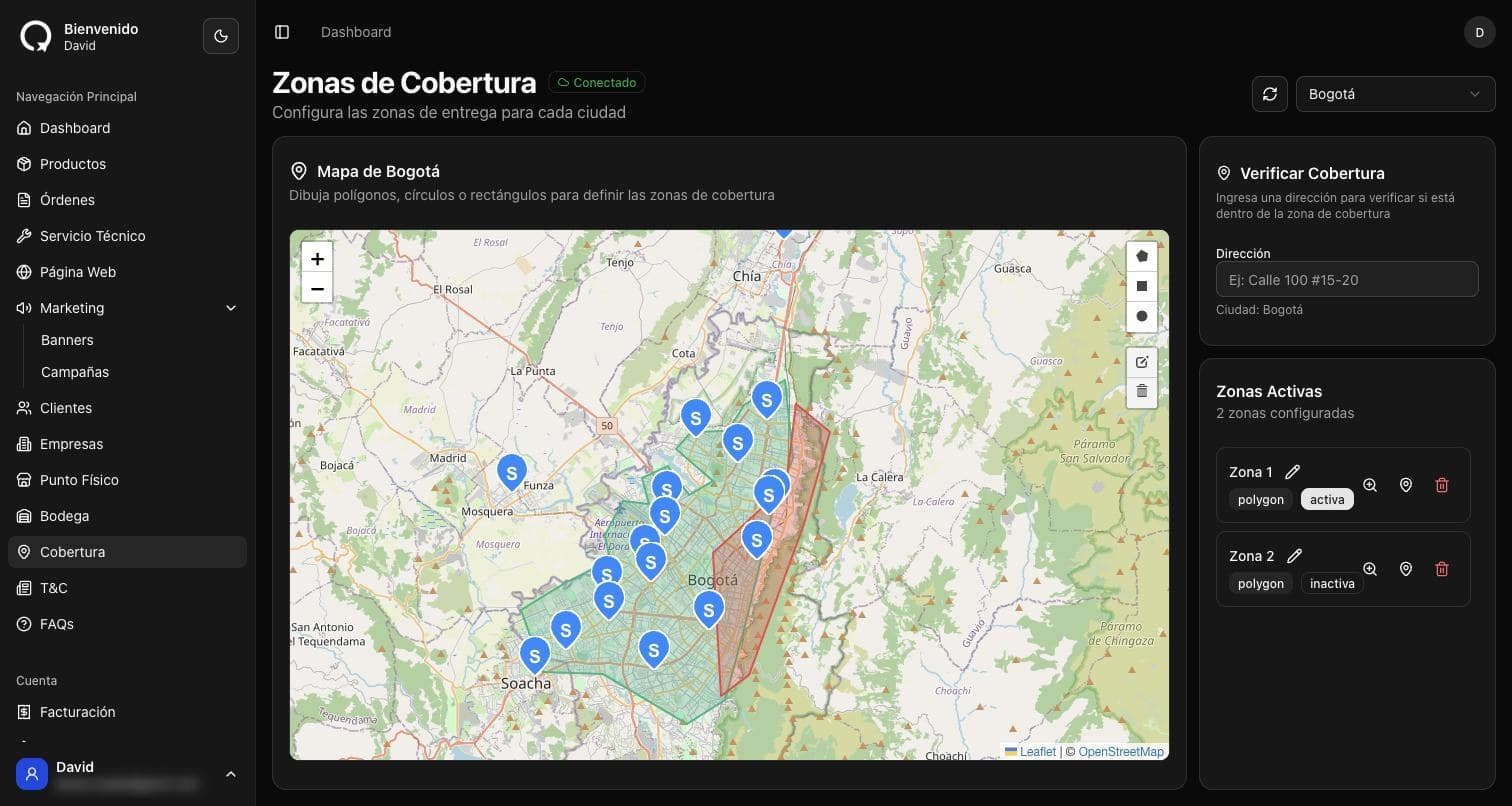
37 stores on a single panel: how Imagiq runs the network, deliveries and demand
When the online store and the points of sale share one inventory, the admin panel becomes the center of the operation. A walk through Imagiq's.
Get a Quote
Complete the form and discover how we can help you achieve your growth goals with custom solutions.